|
Math scores
soar, officials proudly announce
|
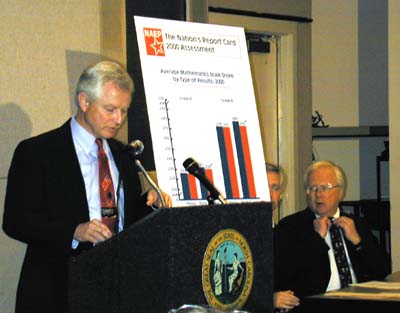
Above,
state superintendent Mike Ward announces the gains in
math scores as Gov. Mike Easley (right) and Phil Kirk,
chairman of the State Board of Education and president
of NCCBI, look on.
|
 |
North Carolina students in the fourth and eighth grades are
scoring above the national average in math tests and are among
the best in the nation, according to state officials who
proudly released the glowing report card on Thursday.
Tar Heel students in grades four and eight -- the two grades
tested as part of the National Assessment of Educational
Progress (NAEP) -- scored comfortably above the national
average on the math test given in the spring of 2000 and well
above the average for states in the Southeast, according to
State Board of Education Chairman Phil Kirk and State
Superintendent of Public Instruction Mike Ward. Gov. Mike
Easley also was on hand at the announcement to add his
congratulations and to remind several legislators who attended
the press conference that now is not the time to cut education
funding.
Of the 40 states and six jurisdictions whose fourth- and
eighth-grade students took the NAEP test, only six states
posted better scores at the fourth-grade level, and only 12
states posted better average scores among eighth graders, Kirk
and Ward said.
Easley, Ward and Kirk all attributed the result to the hard
work of teachers and students and to the states decision to
focus education policy on the basics of reading, writing and
math.
Our progress over time is significant, said Kirk, who
also is president of NCCBI. We gained 20 points (on the
NAEP test) at fourth grade since 1992 and 30 points at grade
eight between 1990 and 2000. No other state has made progress
this dramatic during this time.
"We are so
close to crossing the hump, " Easley said. "We know
our schools can be the top in the nation. We can't let a
budget shortfall become an education shortfall."
Results of the NAEP test, often referred to as The Nations
Report Card, were released in Washington Thursday by Education
Secretary Rod Paige, who mentioned North Carolina four times
in his remarks. "In fourth grade, the two states that
posted the greatest gains from 1992 to 2000 were Texas and
North Carolina, both of which use strong accountability
systems," Paige said. "Since 1990, in eighth grade
math, students in Ohio, North Carolina and Texas made the
greatest achievement gains," he added.
North Carolinas eighth grade students achieved an average
scale score of 280. This score is six points higher than the
national average of 274 and exceeds the Southeast regions
score of 265 by 15 points.
State education officials consider todays news an
endorsement of the states testing and accountability
programs. The big news today is that accountability does
work, Kirk said.
High-stakes testing does work, he added. Today in North
Carolina, more students are reading, writing, and doing match
as much higher levels than they were five years ago when the
ABCs program began. Our teachers and administrators are
working harder than ever before and so are our students
and many of their parents.
Todays good news says stay the course. Continue to
improve the tests and classroom instruction but dont let
the anti-testing people get us off track, Kirk continued.
The math test results were broken down into two groups
those for students with no disabilities and those with
disabilities. In both cases, North Carolinas performance
placed the states average score above the national average.
Only a few states outperformed North Carolina in the
percentage of students who were proficient or above.
The average score for fourth grade students with no
disabilities in North Carolina was 232. This score is six
points higher than the national average of 226 and exceeds the
Southeast regions score of 220 by 12 points.
The score for North Carolina fourth grade students with
disabilities was 230. That is five points higher than the
national average of 225, and nine points higher than the
Southeast average of 221.
North Carolina eighth graders with disabilities had an average
score of 276. The national average was 273, and the Southeast
average was 263.
"The NAEP is a very rigorous measure of what students
should know and be able to do in mathematics at a specific
grade, Ward said. North Carolina students
performance, compared to the nation and our region, verifies
that we are continuing to make important progress in our
schools."
From 1992 to 2000, North Carolinas fourth graders have
improved by 20 points on the NAEP test. This is five
points higher than Texas, the closest other state. North
Carolinas improvement (eight points) in grade 4 from 1996
to 2000 was equal to Virginia and second only to Louisiana
(nine points).
In that same time, North Carolina eighth graders have improved
by 30 points on the test. This is 11 points higher than Ohio,
the closest other state. The change in scale scores from 1992
to 2000 is 22 points, seven points higher than Ohio, again the
closest other state. Since 1996, North Carolinas gain of 12
points is four points higher than Indiana, the state with the
second highest gain.
The NAEP mathematics assessments are typically given every
four years to a sample of approximately 2,400 students in
grades four and eight in participating states. In 2000, two
samples of North Carolina students were selected for
participation in NAEP. In the trend sample, students with
disabilities were not allowed to use accommodations. The
second sample allowed the use of accommodations for students
with disabilities.
State testing officials note that North Carolina schools at
grade four in the trend sample excluded approximately 12
percent of students classified as students with disabilities
while at grade eight, 13 percent of the students were
excluded. These numbers of exclusions were higher than the
national average (6 percent). In the trend sample schools
excluded these students because the appropriate accommodations
were not available to them as required by their Individualized
Education Program (IEP). The trend sample, begun in 1990 for
grade eight and 1992 for grade four, is required to maintain
the same testing procedures for each test administration.
NAEP scores provide a comparison of North Carolina students
with students from other states. North Carolinas own
end-of-grade tests for elementary and middle school students
measure many of the same competencies in mathematics as the
NAEP assessments. North Carolinas performance on the NAEP
mathematics assessments has shown gains each time the tests
have been administered since the early 1990s.
Return to Page One
|